We officially connected to the grid in mid-February. We learned how to use the SolarEdge app to monitor our system and marveled that even on cloudy days or when the panels were partly obstructed by snow, we still generated power.
We received our first power bill with the new system in March, but it included two months of data before and after the installation, and was very difficult to figure out. We thought we’d spare you that and start with our first clean bill in April.
Ok, let’s walk through the data. First thing to notice is NV Energy uses different dates than SolarEdge (our solar system monitor), so figures are not an exact match. NV Energy bills from mid-month to mid-month and dates are constantly adjusted, depending on when the billing period ends. SolarEdge uses a calendar month. There is also about a 5% margin of error between the two metering systems.
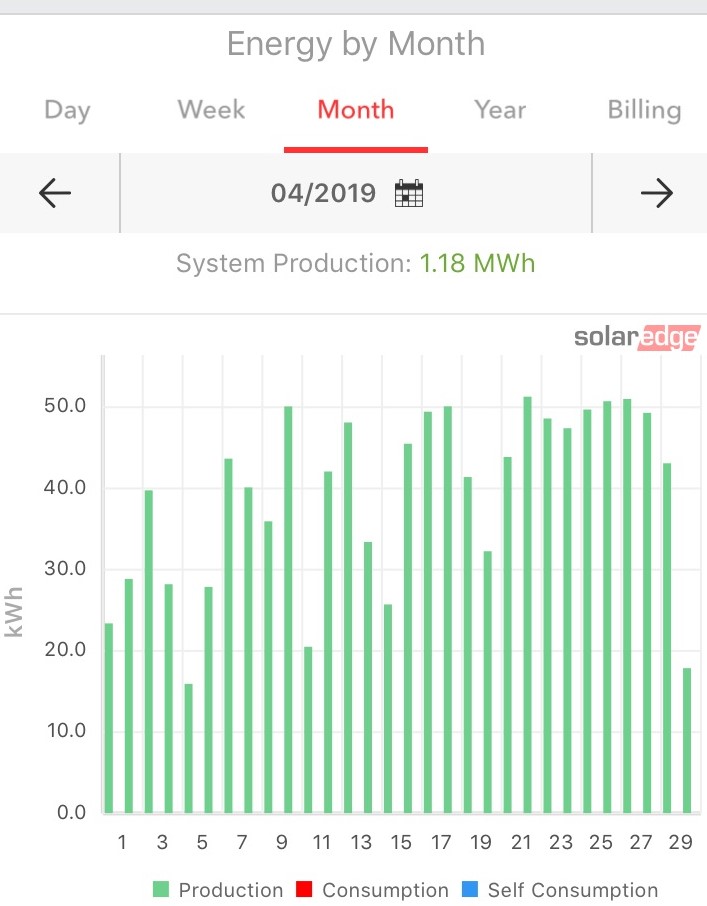
The total solar production SolarEdge shows for April is 1.18 MWh (approximately 1 megawatt). You can see the daily production on the graph and how it fluctuates depending on the weather.
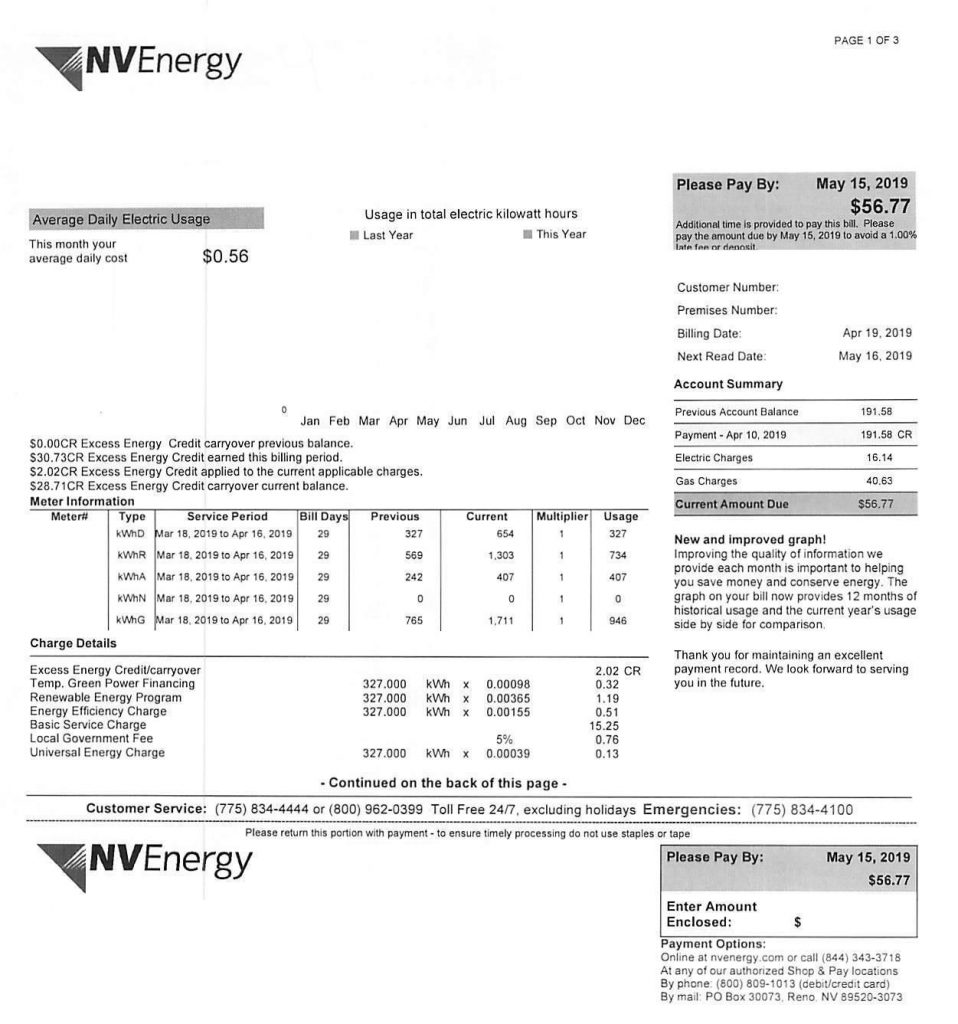
Now let’s walk through the NV Energy bill, starting with Page 1, Meter Information table, Usage column:
kWhD=kilowatt hours delivered from the grid to us (usually at night)= 327
kWhR=kilowatt hours received into the grid from our solar system = 734
kWhA=kilowatt hours accumulated is the difference between what was
received (kWhR) and delivered (kWhD): 734-327=407. This is the amount of kWh banked this month.
kWhN=kilowatt hours net would be the kilowatt hours we would be billed if we didn’t generate enough electricity (or have enough in our bank) to meet our needs. This is 0 because we generated excess power.
kWhG=kilowatt hours generated = 946 (approximately 1 megawatt). This is about the same as the SolarEdge graph shows, given the two different time frames used by the meters and the margin of error.
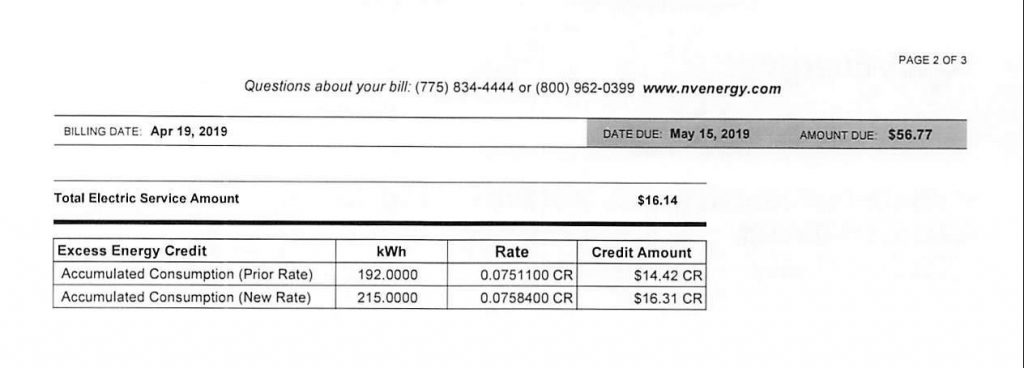
On Page 2 of the NV Energy bill, there is the Excess Energy Credit calculation. This is a little confusing because there was a rate increase mid-period, so there are two different rates on this bill. Add 192 + 215 = 407 (which equals the kWhA from Page 1).
The 407 is multiplied by $.08 (rounded) = $30.73 ($14.42+$16.31) Excess Energy Credit earned. (This shows up on Page 1 above the Meter Information table.)
The $.08 rate used to calculate this credit equals the retail electricity rate ($.09/kWh) less the 12% tariff ($.01/kWh). The tariff is what NV Energy charges for banking excess energy for us. This credit is rolled forward each month and can be used to pay for electricity in months when we may not generate enough of our own power. The cool thing is the banked credits never expire as long as we own our home. The idea behind our system is to break even over the course of the year so we are only paying the $16 for connection to the grid that all NV Energy customers pay. (See Electric Charges on Page 1.)
Going back to Page 1, notice that NV Energy lets us use about $2 of the credit towards our current charges and the rest is a carryover into the next month. You will see this on Page 1 of the May bill.
One other figure I want to explain is the difference between the kWhG figure and the kWhR figure (946-734=212). This represents the electricity we used during the day directly off the solar panels. These kWh never leave our house and are not added to the grid.
So the total amount of electricity we used during the billing period was 212+327=539.
Bottom line:
We generated about 1 megawatt of power in April 2019, exactly what Travis modeled.
We used a little over 1/2 megawatt and banked a little under 1/2 megawatt.
Now let’s see what happens when we add the EV in May 2019.
NOTE: We actually got the LEAF in April, but only charged it a couple of times on the April bill, because we left town for 2 weeks only a few days after we brought her home.